Item Removal Analysis
The “Buyer’s Remorse” Audit: Which products are losing the sale at the very last second?
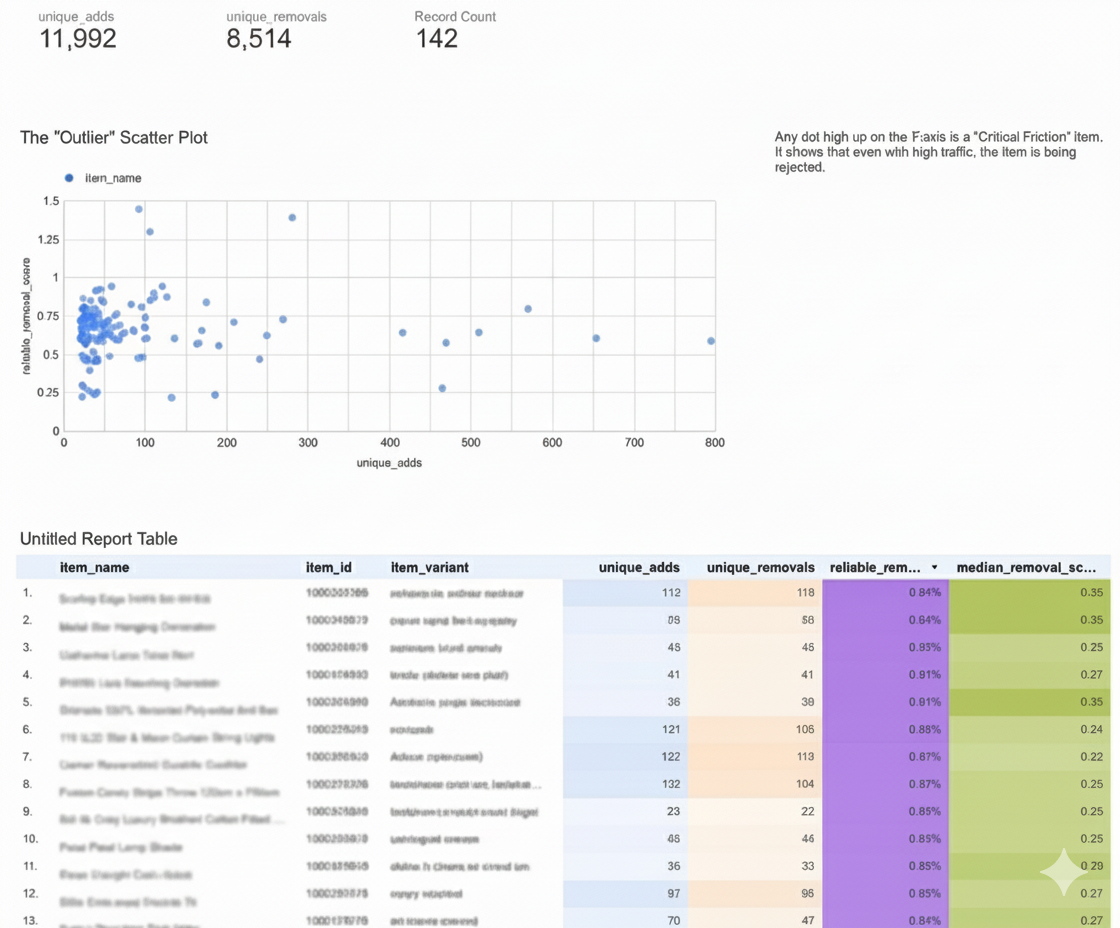
The “Item Removal” analysis is powerful because it identifies “Buyer’s Remorse” or “Cart Confusion.” If people are removing an item frequently, there is usually a problem with shipping costs, confusing variants (size/colour), or a better offer elsewhere.
The Methodology: How We Find the “Real” Friction
Most e-commerce managers look at “Raw Removal Rates” and make expensive mistakes. If a product has 1 Add-to-Cart and 1 Removal, it shows a 100% Removal Rate. Standard Google Analytics would flag this as a disaster, but a professional analyst knows it’s just statistical “noise.”
Our Cart Friction Audit uses advanced data science to ensure you only spend time fixing problems that actually exist.
Applied statistics
We don’t just calculate percentages, we calculate certainty. Using statistics (similar to the math used by companies like Amazon and Reddit to rank quality), our engine determines a Reliable Removal Score.
This score acts as a “Statistical Shield” to:
- Flag “The Leaks”. High-traffic products with even a slightly elevated removal rate are prioritised because they are mathematically proven to be draining your revenue.
- Ignore “The Flukes”. Low-traffic products with high removal rates are filtered out unless the math proves the behaviour is consistent.
Category-Specific Benchmarking
A high-ticket item like a Sofa naturally has a higher removal rate than a £5 Pair of Socks. Customers “window shop” differently in different categories. Our engine calculates the Category Median Removal Score for every specific section of your site. We don’t compare your furniture to your accessories, we compare every product against its own “peer group” to find the true outliers.
Noise Cancellation for Your Trading Team
Standard GA4 reports are full of anomalies. By applying a 95% Confidence Interval to your data, we provide a “Noise-Cancelled” Hit List.
Our Friction Audit: Gives you the 5 items that are statistically certain to be broken.
Traditional GA4: Gives you a list of 50 items that might be broken.
Features
- Weekly Monday Refresh: Start your week with a fresh “Hit List” of products to optimise.
- Rolling 28-Day Window: Always look at enough data to be certain, but stay current with recent trends.
- “Fix-Ready” View: We don’t just give you a table. We highlight the “Reliability Score” so you know exactly which products to focus attention on first.
- No Technical Skills Needed: We handle the math, Python, the SQL and the BigQuery. You just look at the report.
How It Works: 3 Simple Steps
- Subscribe: Choose your plan and complete our secure checkout.
- Access: You’ll get an instant guide in your inbox on how to add our secure Service Account to your GA4 (takes 2 minutes).
- Get Your Link: Within 24 hours, your private, encrypted dashboard link arrives in your inbox.
FAQ’s
- “Can’t I just see this in GA4?” No. GA4 does not offer Wilson Score statistical modeling or automated category-median benchmarking out of the box.
- “Is my data safe?” 100%. We use Google-Cloud-encrypted pipelines and only request “Viewer” access. We never see your customers’ personal names or addresses.
- “What if I have 1,000s of products?” Perfect. That is where our engine shines. It’s designed to find the “needle in the haystack.”
